Commodities · Explainer
Kunkafa Analyzed Gold Since 1833: Is This Fall a Buying Opportunity? Kunkafa’s Forecasts Included
Gold is 36.8% below its January 2026 record. It has fallen this far three times before. A year later it was higher each time, but getting the money back took from under 4 years to more than 45. And this time central banks are buying.

Kunkafa News · Published · 32 min read
 By Kareem FaridDiscuss with the author on X
Here is a visual story in summary
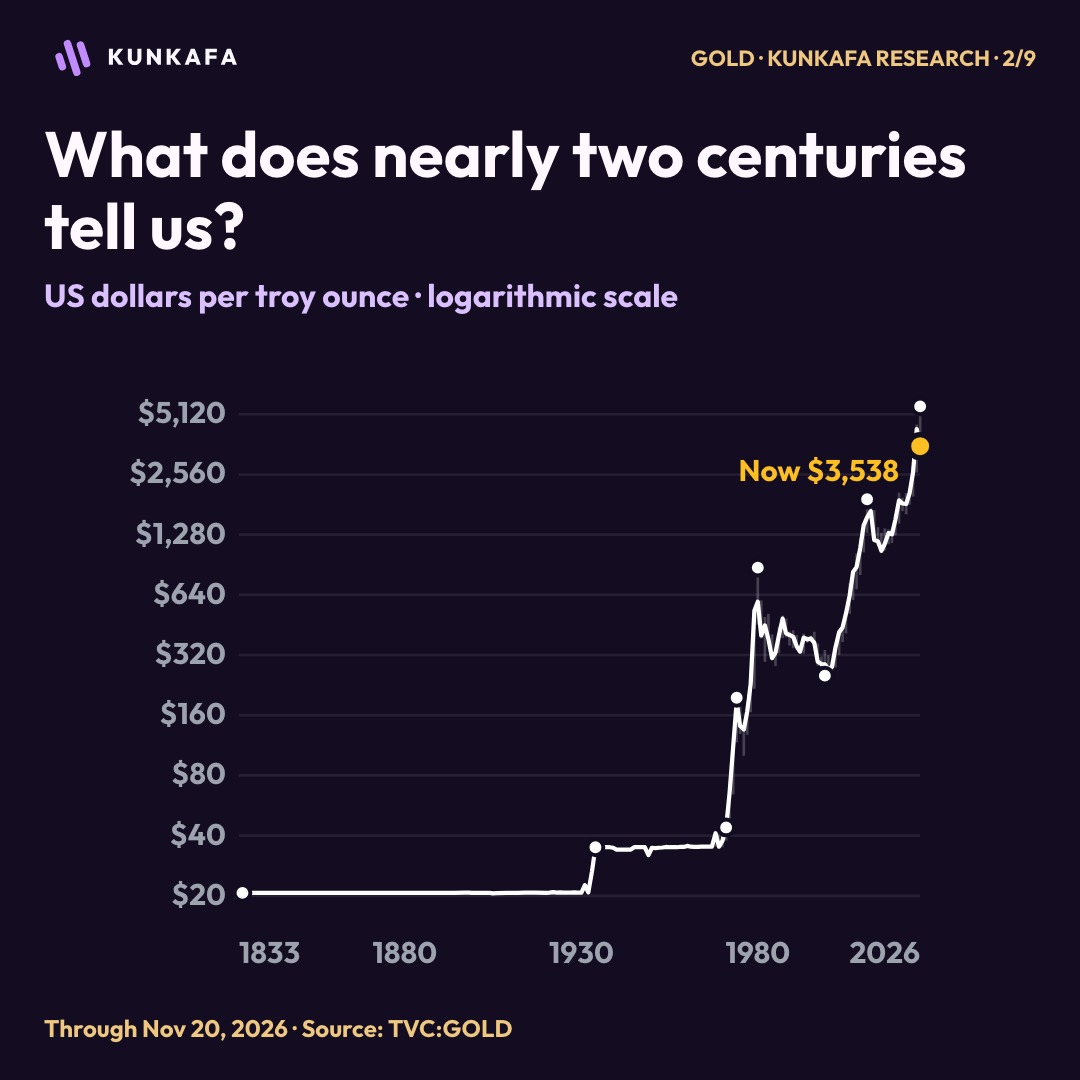
Kunkafa went through the price of gold year by year back to 1833: the gold standard, the 1934 revaluation, the end of the dollar’s link to gold in 1971, two oil shocks, the 1980 record, the 2011 peak and this year’s fall. Kunkafa looked for every time gold fell as far from a record as it has now, and for what happened afterwards to the people who held it or bought it. This is what the record shows.
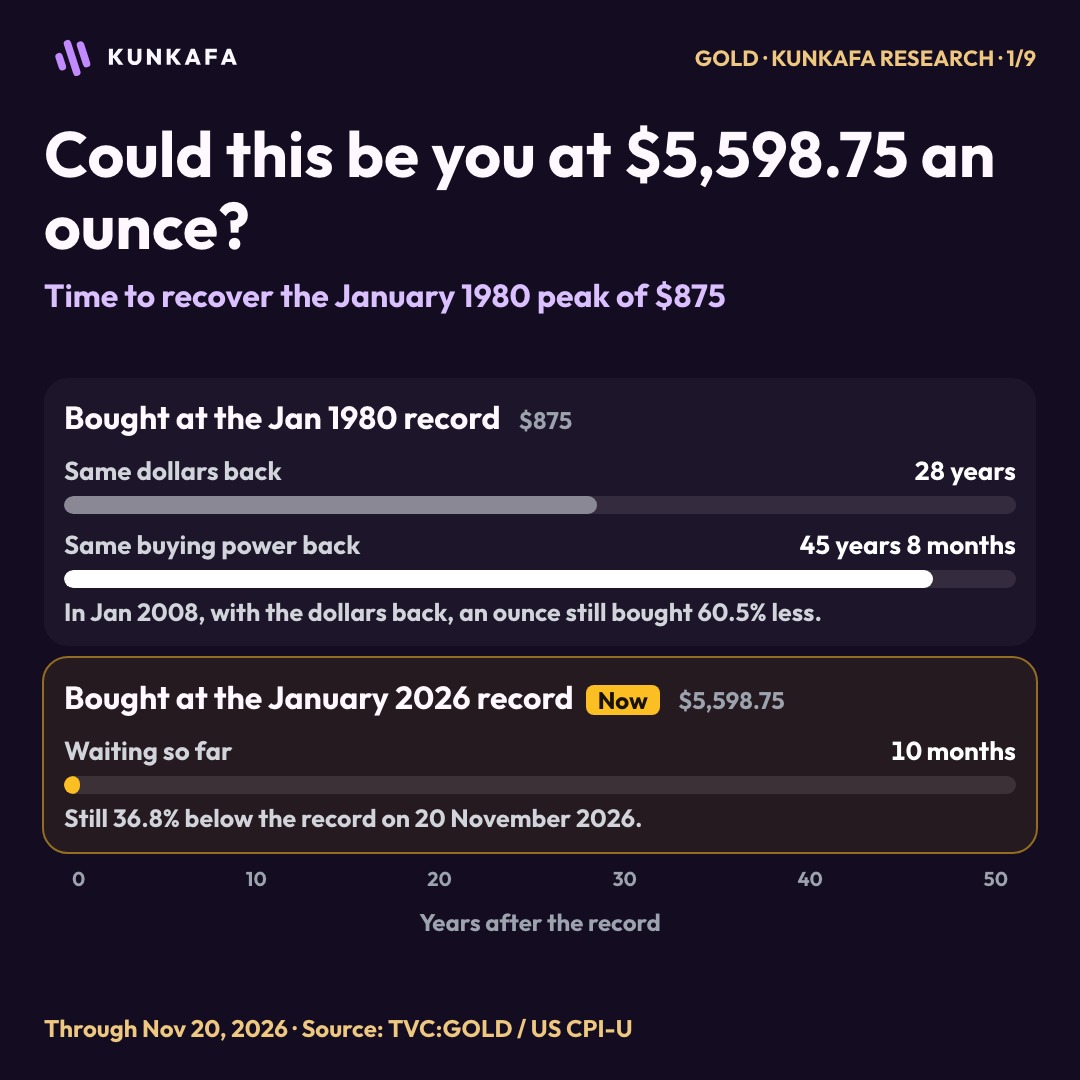
The investor who bought gold at $875 an ounce in January 1980 got the same number back on the screen in January 2008. Twenty-eight years is a long time to wait for your money. It also gave a misleading impression of what that money was worth. To buy the same basket of goods and services in 2008, the investor needed about $2,374 an ounce. Gold first cleared the inflation-adjusted hurdle in September 2025. Someone who bought at 30 had turned 75. [9]
The investor who bought at the June 1982 low lived a different story. Eight months later, that ounce was up 74%. The January 1980 buyer, holding exactly the same metal through exactly the same rally, was still down 41%. Gold’s history contains both experiences. Its price chart today contains another version of them.
Key points
- Is this a buying opportunity? Three earlier buyers at this depth were all ahead a year later, and none of them bought the bottom. See what history says.
- Gold touched a record $5,598.75 in January 2026. On 20 November it stood at $3,537.83, 36.8% lower.
- Since the price was freed in 1971, gold has ended a month at least 35% below its record in three earlier episodes: after the peaks of 1974, 1980 and 2011.
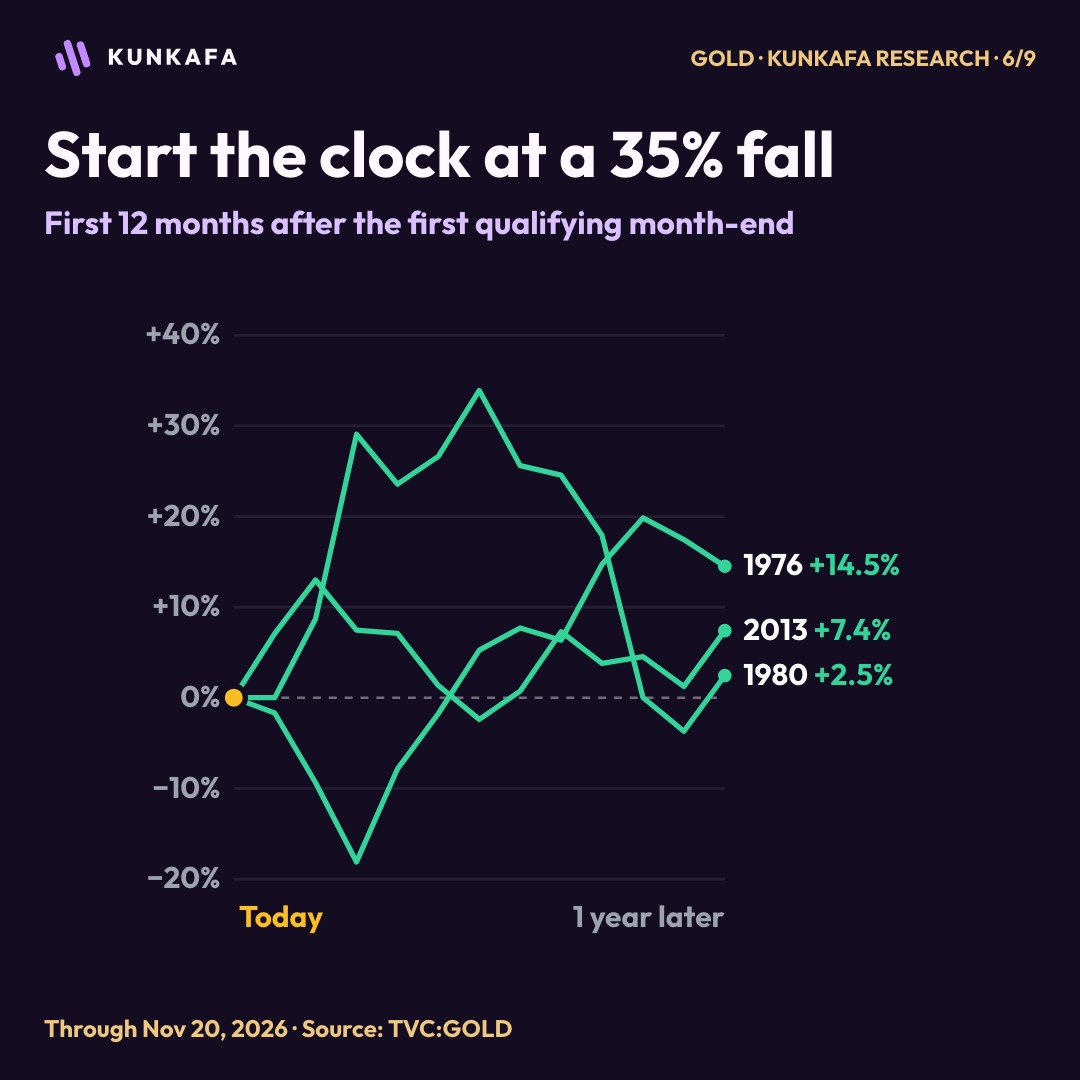
- One year after crossing that line, gold was higher all three times: by 14.5%, 2.5% and 7.4%. After two years, only one of the three was higher.
- Getting the same dollars back took 3 years and 7 months after 1974, 8 years and 10 months after 2011, and 28 years after 1980. After inflation, the 1980 buyer waited 45 years and 8 months.
- Central banks bought a net 321 tonnes in the third quarter of 2026, well above their five-year average, while people’s buying of bars and coins fell to a four-year low.
Where did the last $2,000 go?
An ounce cost $2,797.46 at the end of January 2025. A year later it touched $5,598.75. By November 20 it was back to $3,537.83. Put yourself in the original buyer’s shoes. Of the $2,801 you had made on paper at the peak, $2,061 has disappeared. You have kept $740, barely a quarter of the gain. Yet you are still up 26.5%. The person who bought from you at the top is down 36.8%.
Some people wanted an explanation. Others were looking for a dealer. One X user said they were ready to buy elsewhere after their usual UK supplier pulled back. David Winkleman said he had sold his gold and described how hard he found it to locate a dealer he trusted.
Perspectives on living through gold’s selloff


keikokei · AthenaW · David Winkleman · bonker99 · mahtwm
Kunkafa followed the dollar price of gold back to 1833. Among the three earlier free-market declines that crossed the same 35% threshold on a monthly closing basis, December 1974 produced the closest ten-month path. The opening months looked more like 2011. And to understand how a market can keep delivering spectacular rallies while draining a holder’s savings, the decade to revisit is the 1980s. Each comparison answers a different question.
How rare is a fall this deep?
Rare to begin, and long to live through. Since the dollar price was freed in August 1971, gold has set a record and then ended a month at least 35% below it only four times: after December 1974, January 1980, September 2011 and January 2026. That is four falls in 55 years.
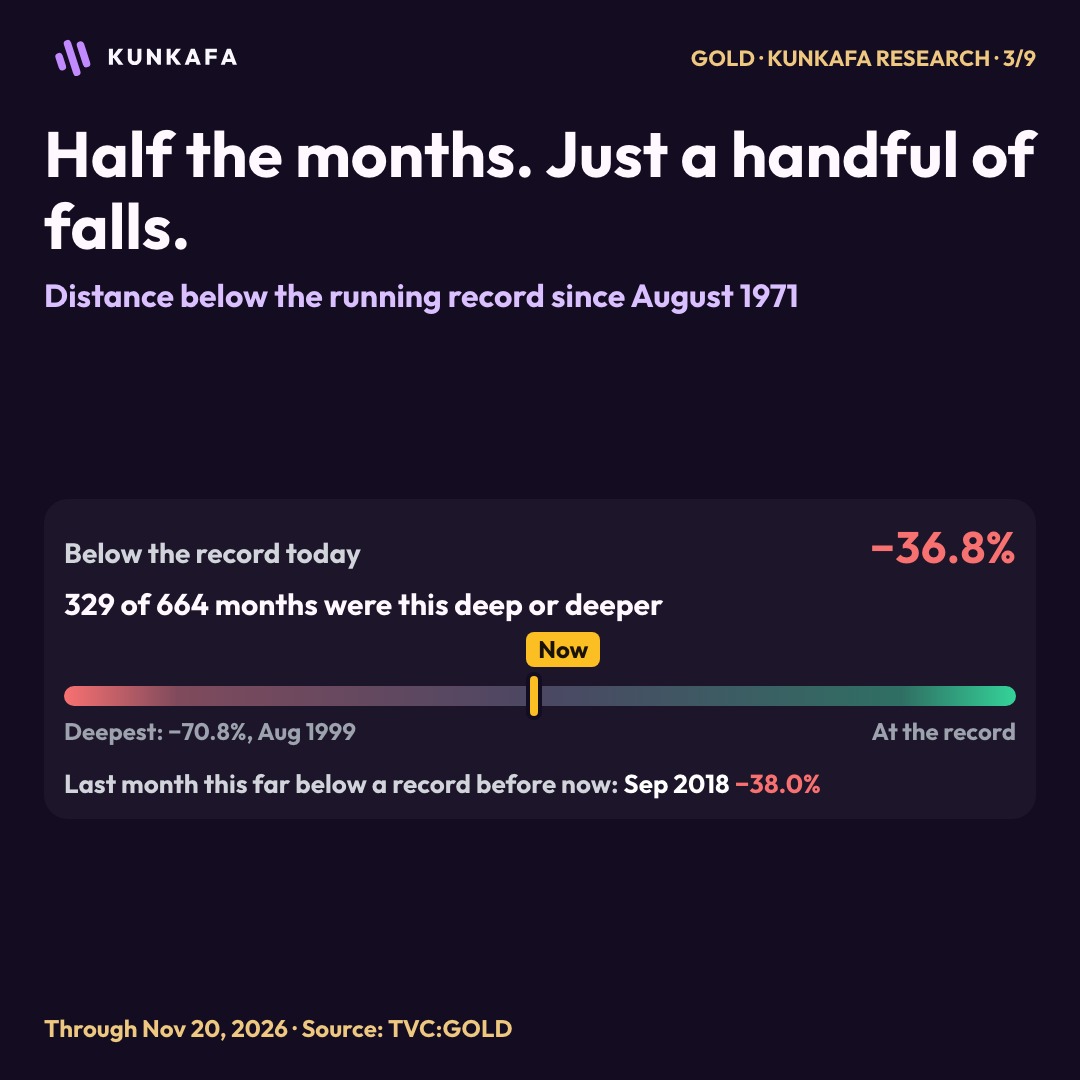
Count the months instead and the picture turns over. Gold ended 329 of the 664 months since August 1971 at least as far below its record as it stands today. That is almost exactly half. One fall accounts for 303 of them: after the 1980 record an ounce stayed this deep for all but seven months until December 2005. The fall after 1974 spent three months here, and the fall after 2011 spent 22. The last such month before this one was September 2018, at 38.0% below the record. A fall like this seldom starts. Once one has started, history offers no promise that it is brief.
What happened after gold fell 35% from a record?
To compare what came next, Kunkafa started a fresh clock the first time a monthly close was at least 35% below the standing record. Each record counted once until gold regained it. That put the three starting lines in May 1976, March 1980 and June 2013. November 2026 provisionally crosses the line. Gold still has the rest of the month to move back above it.
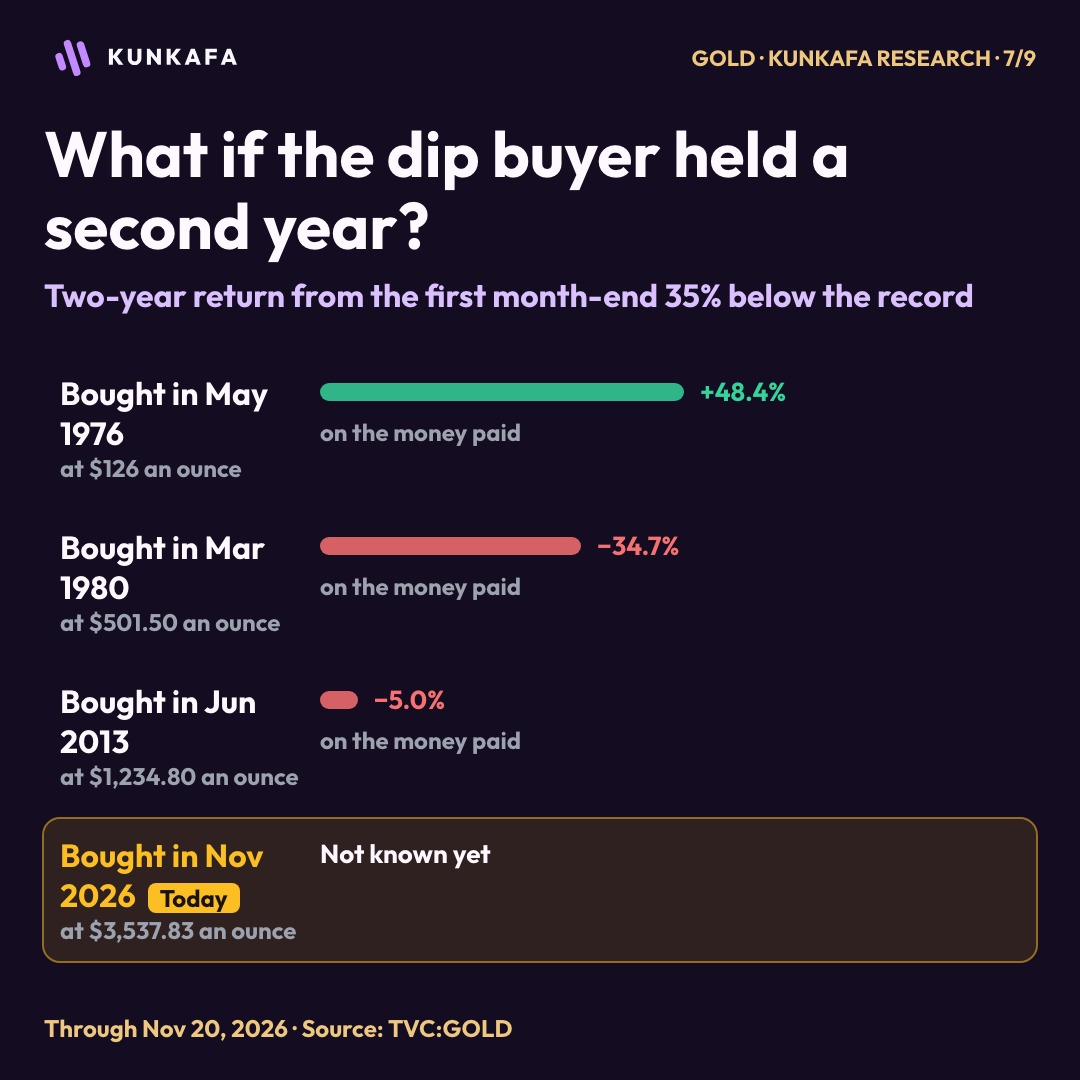
One year later, gold was higher in all three cases: up 14.5% from May 1976, 2.5% from March 1980 and 7.4% from June 2013. Give the same buyers a second year and their fortunes diverged. The 1976 buyer was up 48.4%. The 1980 buyer was down 34.7%, the 2013 buyer down 5.0%. Even the best two-year result began with another 18% loss over the first three months.
Try following those same dip buyers all the way to the eventual low. The buyer paying $126 in May 1976 lost another 20.6% before gold reached $100 three months later. The buyer paying $1,234.80 in June 2013 saw an additional 15.2% loss by December 2015. The most sobering was the March 1980 buyer. At $501.50 that ounce was already 42.7% below the record. It closed slightly higher the very next month. Yet at the August 1999 low it was worth almost exactly half the supposedly cheap purchase price.
The choice of starting line matters. Move it from 35% to 36.8%, about today’s loss, and the first qualifying close in the 2011 cycle shifts from June to December 2013. The one-year return changes from a 7.4% gain to a 1.8% loss. And consider the case left just outside the study: gold fell 34.0% from its March 2008 high to its October low, without a 35% month-end loss. It reclaimed the old high in October 2009. The rule that finds long winters also leaves out a financial crisis with a fast recovery.
Set the clock by the calendar and the answer flips
There is another fair way to ask what comes next. Today gold is ten months past its peak. Where was it a year after that same anniversary in earlier cycles? In the three deep selloffs, the answers were losses of 13.3% after the 1974 peak, 34.6% after 1980 and 18.1% after 2011. The same three episodes that were all higher one year after the 35% loss were all lower one year after month ten.
The reason is visible on a calendar. In 1980 the monthly loss crossed 35% just two months after the peak. After 1974 it took seventeen months. After 2011 it took twenty-one. Today those two clocks happen to agree. Broaden the comparison to every earlier record still unrecovered at ten months and two milder episodes join the sample. A year later gold was up 16.7% in the 2008 case and 2.1% in the 2020 case. The 1974 path remains closest even across those five. None of these starting points supplies a reliable probability for next November.
How long did gold buyers wait to get their money back?
There are two ways to count a recovery. The first is the price on the receipt: the day an ounce sells again for what you paid. The second is what that money buys. After a long wait the two can be decades apart, because prices in the shops kept rising while gold stood still.
The January 1980 buyer shows the gap at its widest. The $875 came back in January 2008, after 28 years. By then it took about $2,374 to buy what $875 had bought in 1980. Even at that month’s high, an ounce bought 60.5% less than at the peak. Gold did not clear the higher bar until September 2025, 45 years and eight months after the purchase. [9]
Compare the price on the receipt with the cost of living. After the 1974 peak the two recovery dates fell less than a year apart. After the September 2011 peak, the nominal recovery came in July 2020, the purchasing-power recovery in September 2024. After January 1980 they were more than seventeen years apart. The extraordinary wait of 45 years and eight months measures how long gold took to touch the old high after US consumer inflation. It excludes storage, dealing costs and any interest the money might otherwise have earned. [9]
For the buyer at January’s record the first clock has run ten months. From the latest price gold would need to rise 58.3% to return to $5,598.75, and every month of inflation moves the second target further away. In the three earlier cases the first clock ran from under four years to 28.
Is 2026 more like 1974, 1980 or 2011?
In December 1974, the month US ownership restrictions were about to end, gold touched $195.50. That was 74% above its close in the same month a year earlier. The Arab oil embargo had nearly quadrupled crude prices, leaving households to absorb higher fuel bills and central bankers to fight inflation in a weakening economy. Gold buyers had good reason to worry about their dollars. They still paid dearly for buying at the peak. [1] [3]
The resemblance starts before the fall. Gold had gained 74% in the year into the 1974 peak, 270% into the 1980 peak and 47% into the 2011 peak, measured from the close in the same month a year earlier. The gain into January 2026 was 100%. The present boom sits much nearer the first than the frenzy that put an $875 price on an ounce in 1980.
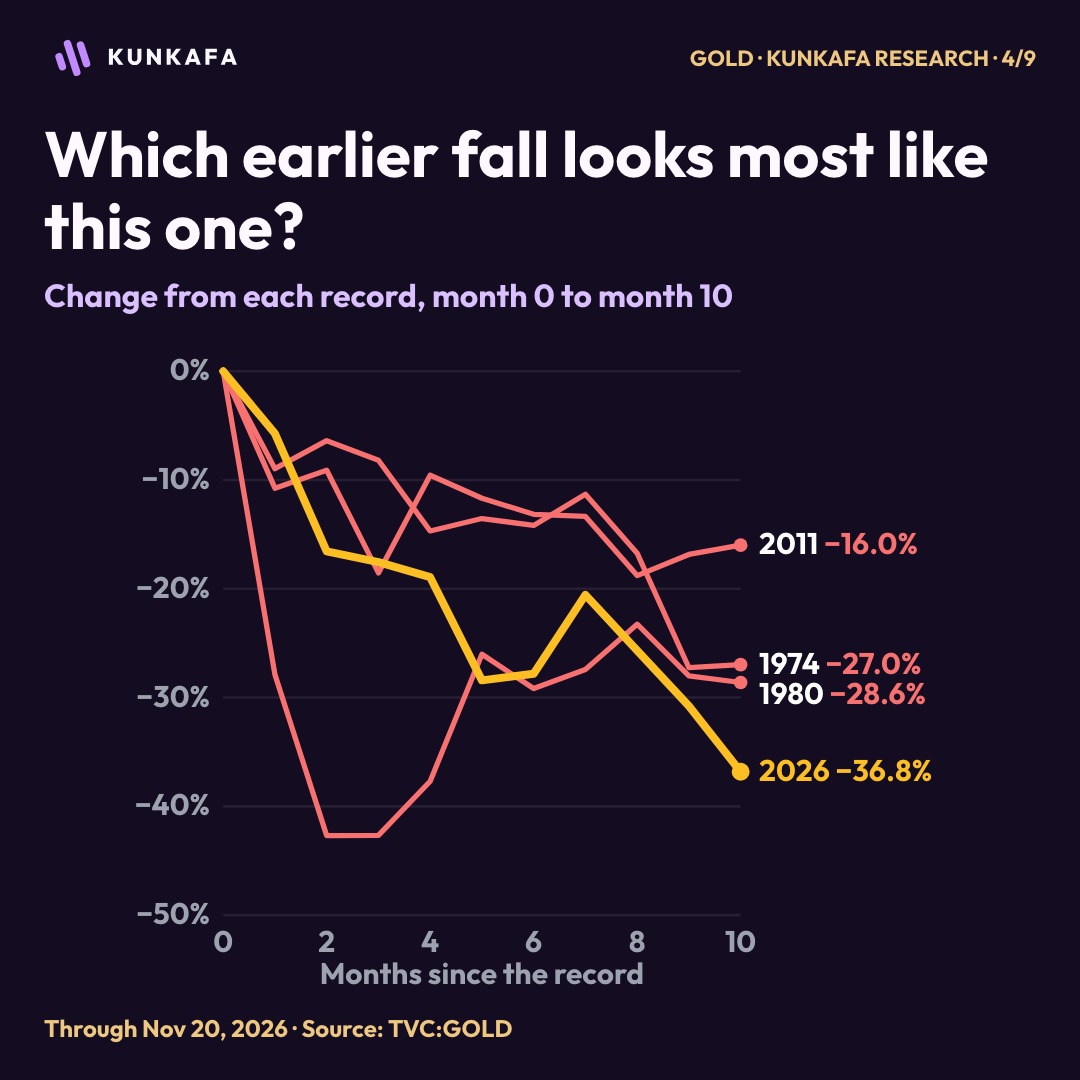
The route down matters, too. Over the first three months the closest match was 2011. Stretch the comparison to ten monthly readings and 1974 ranks first, with a typical gap of 9.5 percentage points by the study’s distance measure, against 11.8 for 2011 and 15.1 for 1980. Still, at month ten gold was down 27% after the 1974 peak and 36.8% today. Today’s buyer has endured a deeper loss than any of the three at this point on the clock.
December 1974’s $195.50 ounce traded at $100 in August 1976. It reached the old price again in July 1978 and its old purchasing power in May 1979. A brutal interruption in a longer bull market is one plausible reading of 2026. The catch for the buyer who recognised it in real time was having to live through an almost 49% fall to earn that vindication. [9]
What a 60% rally bought the investor of 1980
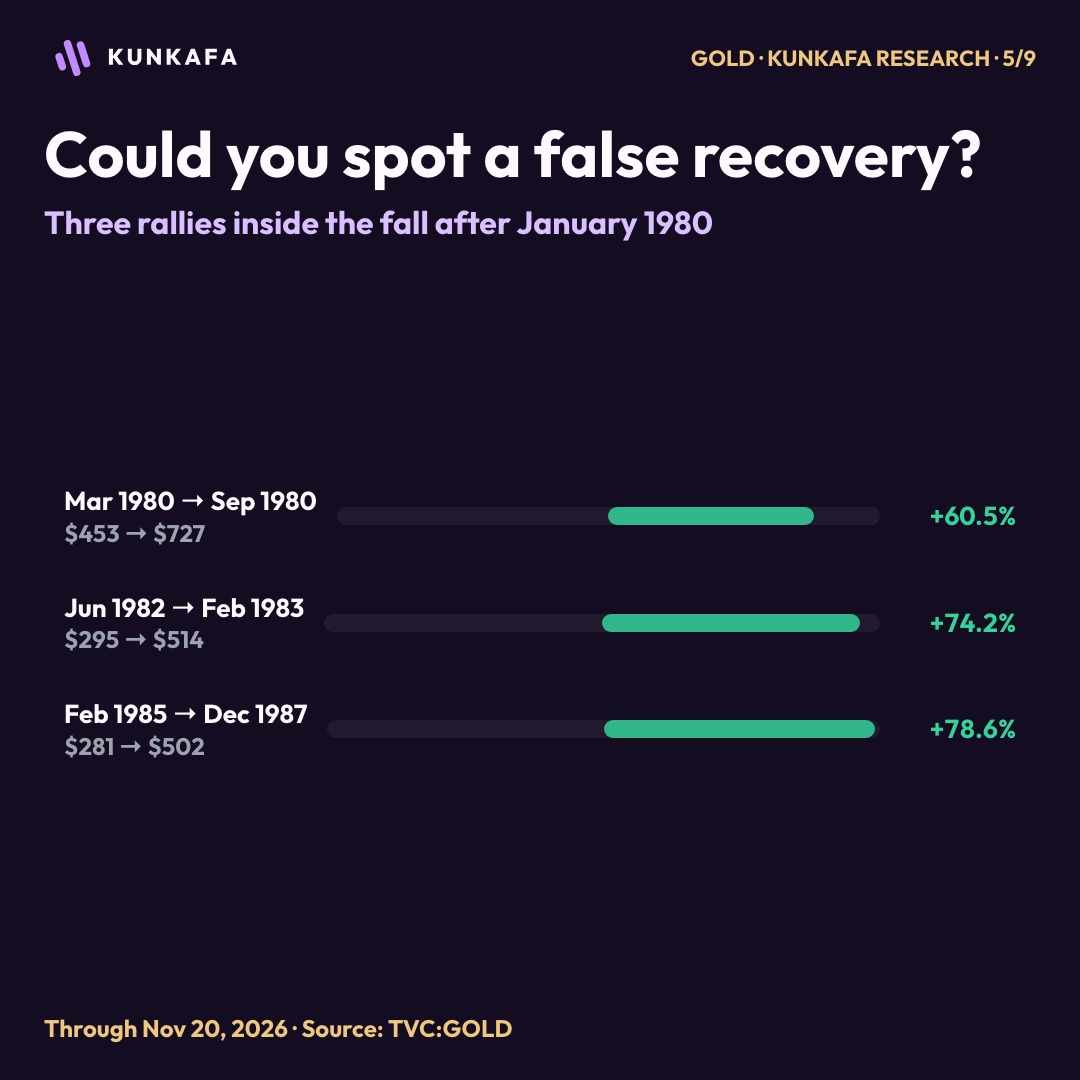
In this series gold touched $875 in January 1980, then $453 in March. By September it was back at $727. A buyer at March’s low had made 60%. A buyer at January’s high still needed another $148 an ounce to break even. The following June 1982 low of $295 wiped out that entire rally. Gold reached $514 in February 1983, fell to $281 in February 1985 and climbed to $502 in December 1987. Three rallies of 60% or more, and the January 1980 buyer was still waiting. The old high held until January 2008.
There is already a smaller version of that experience in 2026. From the June low of $3,942.71 to the August high of $4,697.07, gold rallied 19.1%. From there to November’s $3,502.93 low it fell 25.4%. The summer buyer who correctly called the turn had a profit worth protecting. The January buyer never came close to breaking even. From the latest price it would take a 58.3% gain just to get back there.
Here is what a calendar-year chart can hide. Gold actually finished 1980 up about 11%, from $533.60 the December before to $591.30 at year-end. The same December price left the January peak buyer down 32%. In August 1999 an ounce touched $252.10, 71.2% below that peak. A month later European central banks agreed to limit their collective gold sales to about 400 tonnes a year for five years. Today the debate is how much central banks are buying. In 1999 the news was how much they might sell. [10]
Why a chart reader sees 2012
Market analyst Nour Eldeen Al-Hammoury set the two cycles side by side and pointed to the sequence of peak, correction, rebound and renewed selling. The numbers give his reading some weight. From the May 2012 low to the October high, gold rallied 17.6%. From June to August this year it rallied 19.1%. The rallies were close in size but arrived at different times: the 2012 rebound topped out thirteen months after the record, this year’s after seven.
Al-Hammoury sees a parallel with 2012. Other investors look back to 1980 or to today’s demand for cash.
Perspectives on gold after the peak


By 2012 the market had rewarded the habit of holding through year-end twelve times in a row. From December 2000 to December 2012 gold rose from $272 to $1,675. Every calendar year from 2001 through 2012 ended higher, the longest winning run in the free-market sample. Someone consulting only their December statements still saw a gain in 2012, more than a year after gold had peaked. The 28% loss in 2013 was the first losing calendar year a whole generation of gold buyers had experienced.
The 2013 rout also tells us who can be buying while the price falls. Investors redeemed 881 tonnes from gold ETFs that year even as demand for bars and coins hit a record. By June the price had already closed more than 35% below its record. The Fed announced its first reduction in monthly bond purchases in December, six months later. A story that pins the entire slide on the announcement has its dates backwards. [11] [12]
Who is buying gold as it falls? Central banks, funds and households
A falling price always has buyers. The question is who. In 2026 the three big groups of gold buyers have gone three different ways, and the largest of them bought more as the price came down.
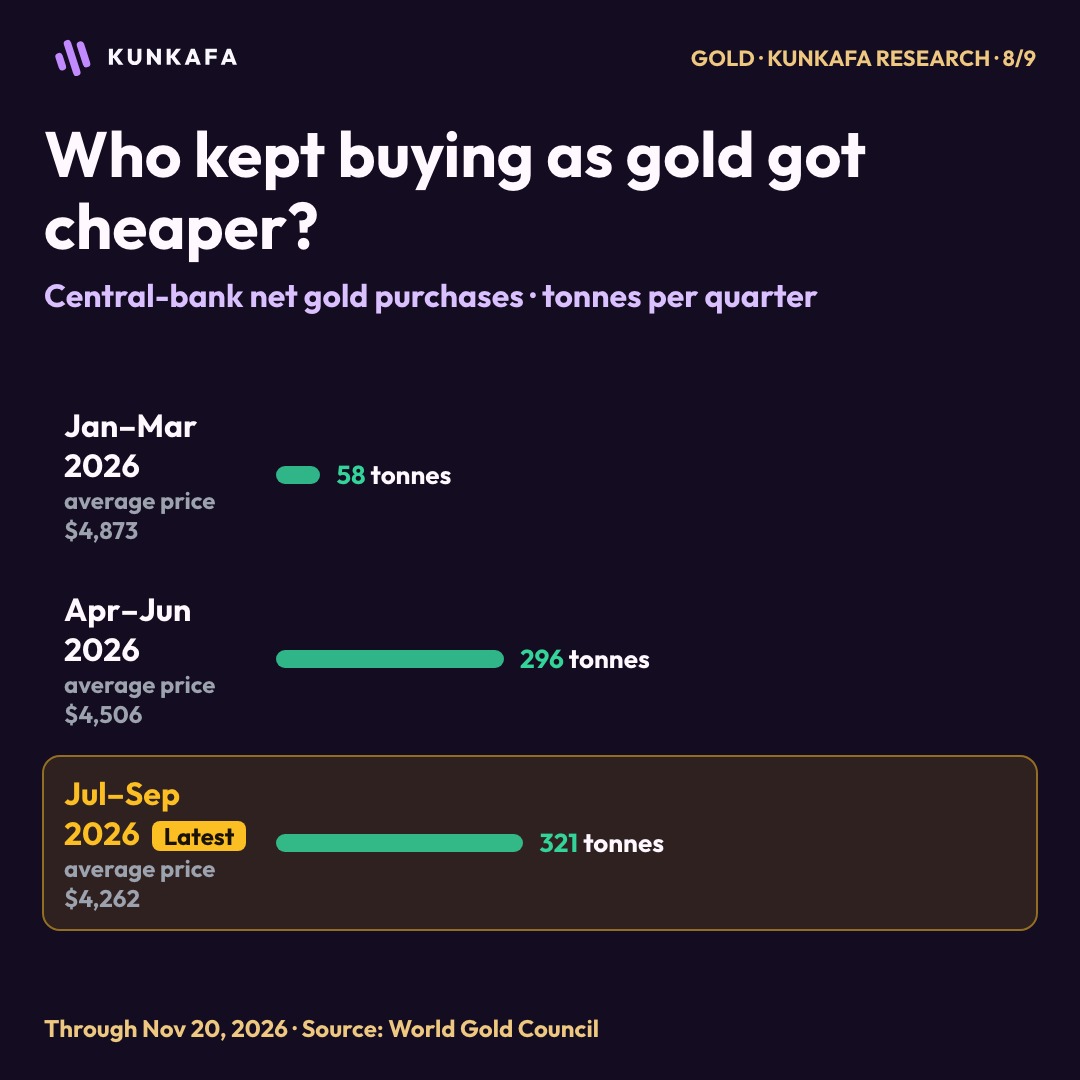
Start with central banks. They bought a net 58 tonnes in the first three months of the year, when gold averaged a record $4,873. As the price came down they stepped in: 296 tonnes in the second quarter and 321 in the third, 42% more than a year earlier and well above the five-year quarterly average of 227 tonnes. For the year to September the total is 675 tonnes, 6% ahead of 2025. Only about 120 tonnes of the third-quarter buying was publicly reported, led by China and Poland. The rest is the World Gold Council’s estimate of purchases that are not announced. [13] [14]
That is the reverse of the falls this one is compared with. In 1976 the official sector was a seller: the International Monetary Fund held its first gold auction on 2 June 1976, two months before the price reached its low of $100, and kept auctioning until May 1980. In 1999, when gold touched $252.10, the news was how much European central banks might sell, and they agreed to cap their sales at about 400 tonnes a year. Central banks as a group have bought more than they sold in every year since 2010. They bought 369 tonnes in 2013 while the price fell 28%, and more than 1,000 tonnes in each of 2022, 2023 and 2024, before easing to 863 tonnes in 2025. [10] [11] [15] [16]
What could be driving it? The council asked 76 central banks between February and May and published the answers in June. A record 45% said they expect to add gold in the next twelve months, and 89% expect central banks as a group to hold more. Asked why they hold it, 90% pointed to how gold behaves in a crisis, 84% to its record as a long-term store of value and 82% to spreading their reserves across more assets. Three in four expect the dollar to make up a smaller share of world reserves in five years. A reserve manager with those aims sees a lower price as a cheaper way to reach a target already set. That is a reading of the survey, not a promise about the months ahead: the same managers bought very little at the January peak. [17]
Funds that hold gold for investors did sell. They let go of 47 tonnes in the second quarter, then bought 211 tonnes in the third and another 19 in October, which took their holdings to a record 4,275 tonnes. The split inside that number matters. US funds were the only sellers in October, and the council suggests some investors sold gold to raise cash as technology shares fell. European funds had taken in money for 18 weeks in a row. Because the price fell, the value of all those holdings still dropped 6% in the month, to $542 billion. [13] [18]
People buying for themselves have pulled back. Purchases of bars and coins ran at 477 tonnes in the first quarter, as the price peaked, then fell to 309 and to 268 tonnes in the third, 19% below a year earlier and the least in four years. The council’s explanation is that buyers were waiting for a clearer direction. Jewellery buying fell 17% to 313 tonnes, the weakest third quarter in its records, with customers switching to lighter pieces and lower carats. [7] [13]
Compare that with 2013. Then it was the funds that fled, selling 881 tonnes in the year, while households bought a record 1,654 tonnes of bars and coins on the way down. In 2026 the roles have swapped: funds and central banks are adding, and households are holding back. A reserve manager spreading a country’s savings and a family trying to afford a wedding bracelet can sensibly do opposite things at the same price. Neither tells you where the price goes next. In 2013 the record household buying did not stop a 28% fall. [11]
Gold price history since 1833: when the price of an ounce was government policy
The first ounce in the file costs $20.65. Open the yearly chart and the long stretches of little movement tell a monetary history of their own. Under the US gold standard the dollar carried an official gold value. In 1934 Washington raised the official price to $35. In 1971 President Richard Nixon ended foreign official convertibility. For much of the early record, an ounce and a dollar were tied together by law. Treating those years as evidence that modern gold rarely crashes would give the wrong answer. [1] [2]
Take 1864. The file records $20.65, the same as in 1833. Yet a Federal Reserve study puts the wartime price of an ounce above $40 in paper greenbacks after the government suspended convertibility. A merchant who needed gold and held paper money faced a very different price from the one preserved in this series. The early chart tells us what a dollar meant under different monetary arrangements. It cannot tell us every price Americans actually paid. [8]
Once the link broke, whole decades acquired a character of their own. In the 1970s gold multiplied more than fifteenfold, from $35.19 at the end of 1969 to $533.60 at the end of 1979. The next decade cost holders 24.6%, the one after that another 28.6%. Across the 2000s an ounce gained 281%. On the yearly chart the distance between those peaks is the better part of a working life.
The last surge deserves its own place on that chart. Gold gained 64.5% in calendar 2025, fourth among the 54 complete years from 1972 through 2025. After US inflation the gain was 60.3%, second only to 1979. By November 20 this year gold was down 18.1% from December. That is how an ounce could lose more than a third from its high and still sit comfortably above its price two Decembers ago. [9]
Is this a buying opportunity for gold?
History cannot answer yes or no. It can show what happened to the three people who stood where a buyer stands today: at the end of the first month in which gold closed at least 35% below its record. They paid $126 an ounce in May 1976, $501.50 in March 1980 and $1,234.80 in June 2013.
None of them bought the bottom. All three saw a lower price afterwards. The 1976 buyer was down 18.1% three months later. The 2013 buyer was down 14.1% by December 2015. The 1980 buyer was down 49.1% by August 1999. A fall of 35% from the record has marked a deep discount three times. It has not once marked the low.
A year later all three were ahead. The gains were 14.5%, 2.5% and 7.4%. After that the three stories part. The 1976 buyer sat through five months below the purchase price and never saw it again: the gain was 48.4% after two years and 280.5% after five. The 2013 buyer waited: down 5.0% after two years, up 1.4% after five and up 55.4% after ten. The 1980 buyer was down 34.7% after two years and still down 26.2% after ten, and gold last ended a month below that $501.50 in November 2005, more than 25 years on.
The wider count. Take every earlier month that ended this far below the record, 328 of them. Gold was higher one year later in 169, a little over half. It was higher five years later in 204, and ten years later in 208 of the 324 that have a ten-year result. The typical five-year gain was 6.6%. These months are not 328 separate tests: 303 belong to the long fall after 1980, so the count leans heavily on one episode.
What history does say. Buying this far below the record has paid quickly once, slowly once and not for a generation once. All three bought at the same discount, so the discount cannot explain the difference. In the two cases from the 1970s, what differed was how the Fed met inflation afterwards. That is why the comparison with the 1970s matters, and it is the next question. This is a record of what happened, not advice.
Is this 1970s stagflation again? War, oil, inflation and the missing piece
The comparison almost writes itself. In October 1973 Egypt and Syria went to war with Israel, Arab oil producers cut off the United States, and the price of a barrel of oil nearly quadrupled by January. Five years later came Camp David, the Egypt–Israel peace treaty of March 1979, and in the same months a revolution in Iran that set off the second oil shock. In 2026 the war is with Iran itself. It began on February 28, and the Fed’s October minutes blame the Middle East conflict for this year’s jump in energy prices. Russia’s war in Ukraine has been running since February 2022. [3] [4] [5] [22] [23]
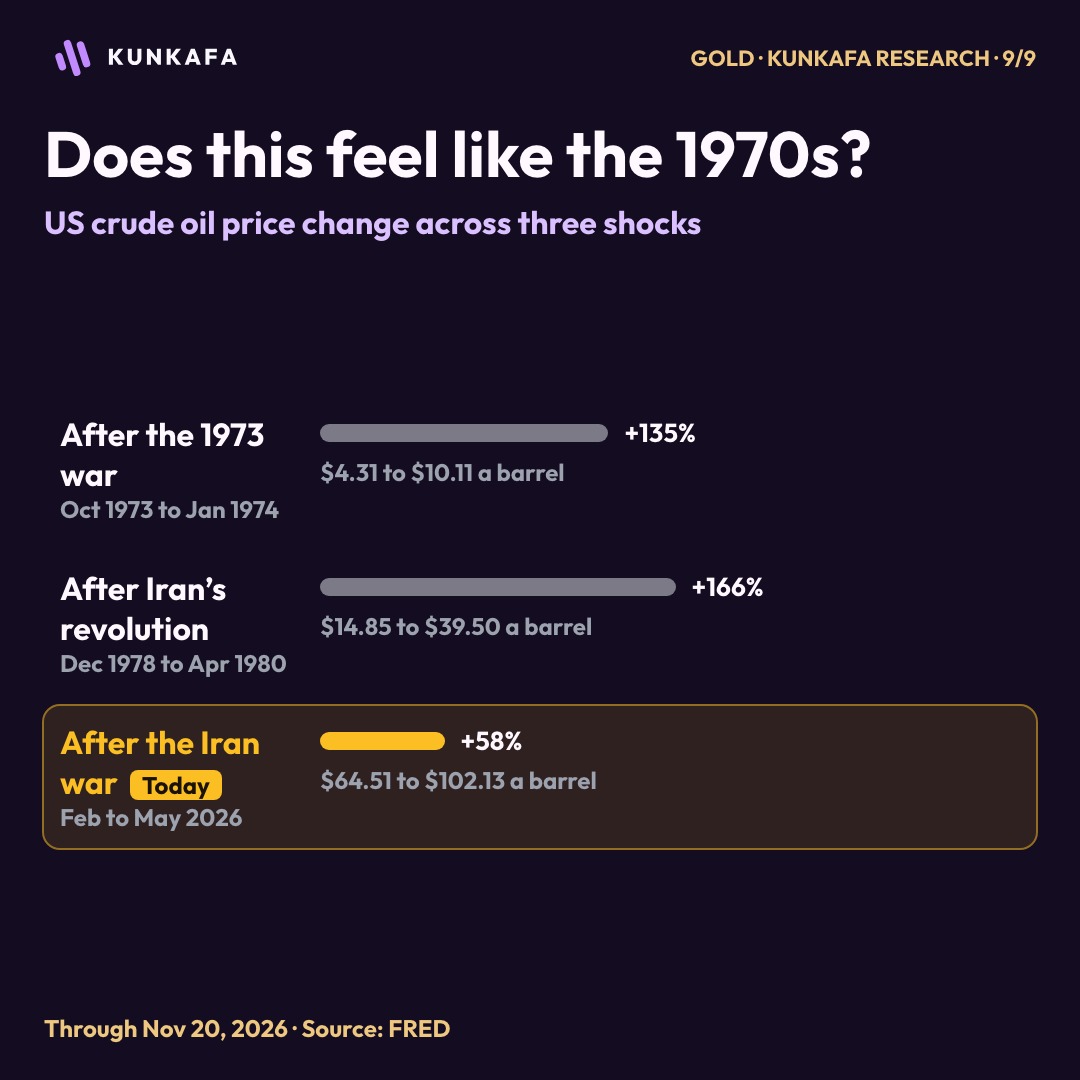
The oil. US crude averaged $64.51 a barrel in February and $102.13 in May, a 58% rise in three months. It eased over the summer and was back at $102.07 in October. That is a severe shock. It is also less than half the size of either 1970s one. By the same measure, US crude went from $4.31 to $10.11 between October 1973 and January 1974, and from $14.85 to $39.50 between December 1978 and April 1980. [19]
The inflation. US consumer prices were rising 2.4% a year in February. By May the rate was above 4%, and in September it stood at 3.7%. The direction matches the 1970s. The scale does not: inflation reached 12.3% in December 1974 and 14.8% in March 1980. [9]
The missing piece. Stagflation is inflation with stagnation, and the second half has not arrived. Unemployment went from 4.6% in October 1973 to 9.0% in May 1975. It went from 6.0% in December 1978 to 10.8% in December 1982. This year it was 4.4% in February and 4.1% in October, and the Fed’s October minutes describe an economy growing at a strong pace. So far 2026 has the inflation without the lost jobs. [20] [5]
Which Fed is this? The 1970s gave two answers. In 1974 the Fed’s overnight rate averaged 12.9% in July. By May 1975, with unemployment at 9%, it was down to 5.2% while prices were still rising 9.5% a year. Paul Volcker’s Fed did the reverse: in June 1981 the rate averaged 19.1% against inflation of 9.6%. Today’s Fed cut three times late in 2025, held through the oil shock, and raised its target range in September to 3.75%–4%, about level with inflation. [21] [24] [4]
Gold did the opposite. In the 1970s gold climbed with oil: 74% in the year into the December 1974 record and 270% into January 1980. This time the record came in January, a month before the war began. Oil then passed $100 and gold never returned to its high. Whatever drove buyers to gold in 2025, this oil shock did not bring them back.
The verdict. This is our analysis of public data, not a Kunkafa forecast. Three of the four ingredients are present: a war in an oil region, an energy shock and inflation above the Fed’s 2% goal. The fourth, a shrinking economy, is absent. The label would fit if unemployment climbed while inflation stayed above 3%. It would fade if the Fed’s staff is right that inflation could step down sharply next year as energy prices slow. For the buyer of gold the two endings were very different. After 1974 the Fed eased, and the old record returned in 3 years and 7 months. After 1980 it held rates far above inflation, and the wait was 28 years. Two cases prove nothing. They do show which question to keep asking. [5]
The question gold shares with the 1970s
The shared question is what an investor can earn outside gold while waiting for inflation to cool. An ounce pays no interest. A rise in the yield on bonds after inflation gives the saver a competing home for the same dollars. Paul Volcker’s Fed pushed rates higher through two recessions. Today the Fed entered November at 3.75%–4%, with two officials voting in October for a quarter-point increase. The World Gold Council reported on November 16 that US ten-year inflation-protected yields had risen about 0.30 percentage point that month as the dollar strengthened. [4] [5] [6]
Could the 1980s happen again? The smaller version already has: a 19% rally took place inside a decline that went on to make a new low. A decades-long bear market is a much bigger claim. The ten-month price evidence favours the 1974 comparison, when the old high returned within four years. Ahead of the December 8–9 Fed meeting, watch whether real bond yields keep rising and whether another wave of buying can carry gold past August’s $4,697 high. Until then, two statements about the same ounce remain true. It has made money for the buyer of January 2025. It still owes the buyer of January 2026 more than $2,000. [5]
What Kunkafa’s AI forecasts for gold now
History is one way to read this fall. Kunkafa’s AI model is another. Kunkafa does not say where gold ends up. It gives targets above and below the price, each with a duration and Kunkafa’s confidence that gold could touch that target at least once within it. These are among Kunkafa’s gold forecasts as read on November 21, 2026, measured from the previous day’s close of $3,537.83.
The upside. Kunkafa’s confidence is 94% that gold could touch $3,706 within six months, 4.753% above that close. It is the highest confidence on the list. The other upside targets: $3,661 within 50 days (confidence 75%), $3,746 within six months (82%), $3,786 and $3,734 within one year (85% and 81%), and $3,655 within two years (80%).
The downside. Confidence is 86% that gold could touch $3,346 within 50 days, 5.409% below the close, and 75% for $3,405. Further out, the targets are $3,409 (92%) and $3,269 (70%) within three years, and $3,356 (93%) and $3,227 (70%) within seven years.
How to read them. Each target is the median move Kunkafa forecasts, so the price could still swing beyond it or stop short of it. The up and down targets do not contradict each other: gold could touch both within the same duration. And a touch counts once. The price need not stay there.
How often has Kunkafa been right on gold? The block below is Kunkafa’s latest full report for gold. It takes every settled gold forecast at Kunkafa’s confidence of 95% or higher and places each by how far the price travelled toward its level. The report covers durations up to 50 days. The six-month to seven-year forecasts above have not had time to settle, and their confidence is below 95%; the report’s lower confidence floors are linked under the block. Forecast, not advice.
Latest full report
How far Gold went toward Kunkafa’s levels
Friday 4 September to Friday 13 November 2026 · at Kunkafa’s confidence of 95% or higher
- went 300% or more10.8%
- went 200 to 300%8.7%
- went 125 to 200%28.6%
- went 100 to 125%, reaching the level44.5%
- went 75 to 99%1.7%
- went 50 to 75%1.9%
- went 25 to 50%1.8%
- went under 25%2.0%
50,352 forecasts at Kunkafa’s confidence of 95% or higher, both directions, every duration up to 50 days. Every band is a share of the distance to the forecast level, not a price change: 100% is the level itself, 300% is three times that distance, 50% is halfway there.
Weekly and monthly editions and lower confidence floors, from 90% down to 60%, are in the Gold reports.
Gold’s fall in seven questions
How far has gold fallen from its record high?
Gold reached $5,598.75 an ounce in January 2026 and stood at $3,537.83 on 20 November 2026, a fall of 36.8%. It is still 26.5% above its price at the end of January 2025.
Has gold fallen this much before?
Yes. Since the dollar price was freed in 1971, gold ended a month at least 35% below its record after the peaks of December 1974, January 1980 and September 2011. The first fall reached almost 49% by August 1976. The second reached 71.2% by August 1999.
What happened to gold a year after earlier 35% falls?
It was higher all three times: by 14.5% after May 1976, 2.5% after March 1980 and 7.4% after June 2013. After two years the results split: up 48.4%, down 34.7% and down 5.0%. Three cases are too few to give a probability.
How long did gold take to recover after the 1980 crash?
In dollars, 28 years: the January 1980 record of $875 was reached again in January 2008. After US inflation it took 45 years and eight months, until September 2025. After the 1974 record the two waits were 3 years 7 months and 4 years 5 months. After 2011 they were 8 years 10 months and 13 years.
Are central banks buying or selling gold in 2026?
Buying. Central banks added a net 321 tonnes in the third quarter of 2026 and 675 tonnes in the first nine months, 6% more than in the same months of 2025, according to the World Gold Council. In its June survey a record 45% of central banks said they expect to add gold within a year.
Why did gold fall in 2026?
Money can earn more elsewhere. The Federal Reserve’s rate stood at 3.75%–4% in November, with two officials voting in October for an increase, and US ten-year inflation-protected yields rose about 0.30 percentage point that month as the dollar strengthened. An ounce pays no interest, so a higher yield after inflation gives savers another home for the same dollars.
Is gold a buying opportunity after a 35% fall?
History gives three outcomes, not one. Buyers at the end of the first month 35% below a record were ahead a year later all three times, by 14.5%, 2.5% and 7.4%. After ten years the 1976 buyer was up 173.1% and the 2013 buyer was up 55.4%, while the 1980 buyer was still down 26.2%. All three saw a lower price after buying. This is a record of what happened, not advice.
Study notes · TradingView TVC:GOLD, nominal US dollars per troy ounce. The export has 1,334 observations in 169 calendar years from 1833 to November 2026, with gaps in the early years. The yearly chart uses the last available observation in each year. The comparison uses monthly prices after August 1971. Kunkafa ranked the three earlier qualifying episodes by the root-mean-square difference between their losses from the record and today’s, at each of months one through ten. Forward returns start at the qualifying monthly close. A return to the record is the first subsequent month whose high reaches it.
Inflation comparison · Kunkafa divided each monthly high by that month’s unadjusted US CPI-U and located the first later month that matched the peak’s purchasing power. The result dates a trade within a month. It does not require a sustained recovery. All other study figures are nominal. The current export includes an unfinished November monthly bar. [9]
Sources · [1] Gold Reserve Act · [2] Federal Reserve balance sheet history · [3] 1973–74 oil shock · [4] The Great Inflation · [5] October FOMC minutes · [6] World Gold Council, Nov. 16 · [7] Gold Demand Trends Q3 2026 · [8] Federal Reserve, Civil War gold prices · [9] BLS consumer price index via FRED · [10] ECB gold agreement, 1999 · [11] Gold Demand Trends 2013 · [12] Federal Reserve, December 2013 · [13] Gold Demand Trends Q3 2026, supply and demand table · [14] Gold Demand Trends Q3 2026, central banks · [15] Congressional Research Service, IMF gold auctions · [16] Gold Demand Trends 2025, central banks · [17] World Gold Council, central bank survey, June 2026 · [18] World Gold Council, gold fund flows, October 2026 · [19] US crude oil price via FRED · [20] US unemployment rate via FRED · [21] Federal funds rate via FRED · [22] US State Department, Camp David Accords · [23] ABC News, Iran war timeline · [24] Federal funds target range via FRED
Kunkafa forecasts
Gold
How far it could move, which way, by when, and how confident Kunkafa is.
Check the latest forecastsRelated articles
 CommoditiesGold Keeps Bleeding. It’s Now Nearly 37% Below Its RecordSpot gold has lost nearly 37% since its January record. A strong dollar and bets on a December Fed hike are weighing on bullion as Asian trading continues.
 Research · 47 min read2027: Risks, Opportunities and Kunkafa’s Forecasts, From AI to Popular UnrestThe market risks for 2027, with data: AI prices, chips waiting for power, rate hikes, Europe’s inflation, two wars on oil and grain, and the opportunities left.
 MarketsThe World Watches a Year’s Gains Slip Through Its FingersKunkafa ranks the Nasdaq 100 and S&P 500 selloff against decades of price data and measures returns one, five and 21 trading sessions after similar losses.
More in Commodities

Black Friday for Gold? It’s 37% Off. Who’s Buying?
Gold looked irresistible to some buyers at its January peak. Now one investor says he has run out of cash buying dips. Another just bought five ounces.

Gold Keeps Bleeding. It’s Now Nearly 37% Below Its Record
Bullion has shed more than $2,000 an ounce since January, with this week’s drop putting it on course for its steepest weekly loss in eight months.

Copper Hits Four-Month Low as China Investment Falls
London copper touched $13,210.50 a tonne on its third day of losses. China reported declines in property, infrastructure and manufacturing investment.