By the Kunkafa team
Kunkafa and Konafeh: What Do They Have in Common?
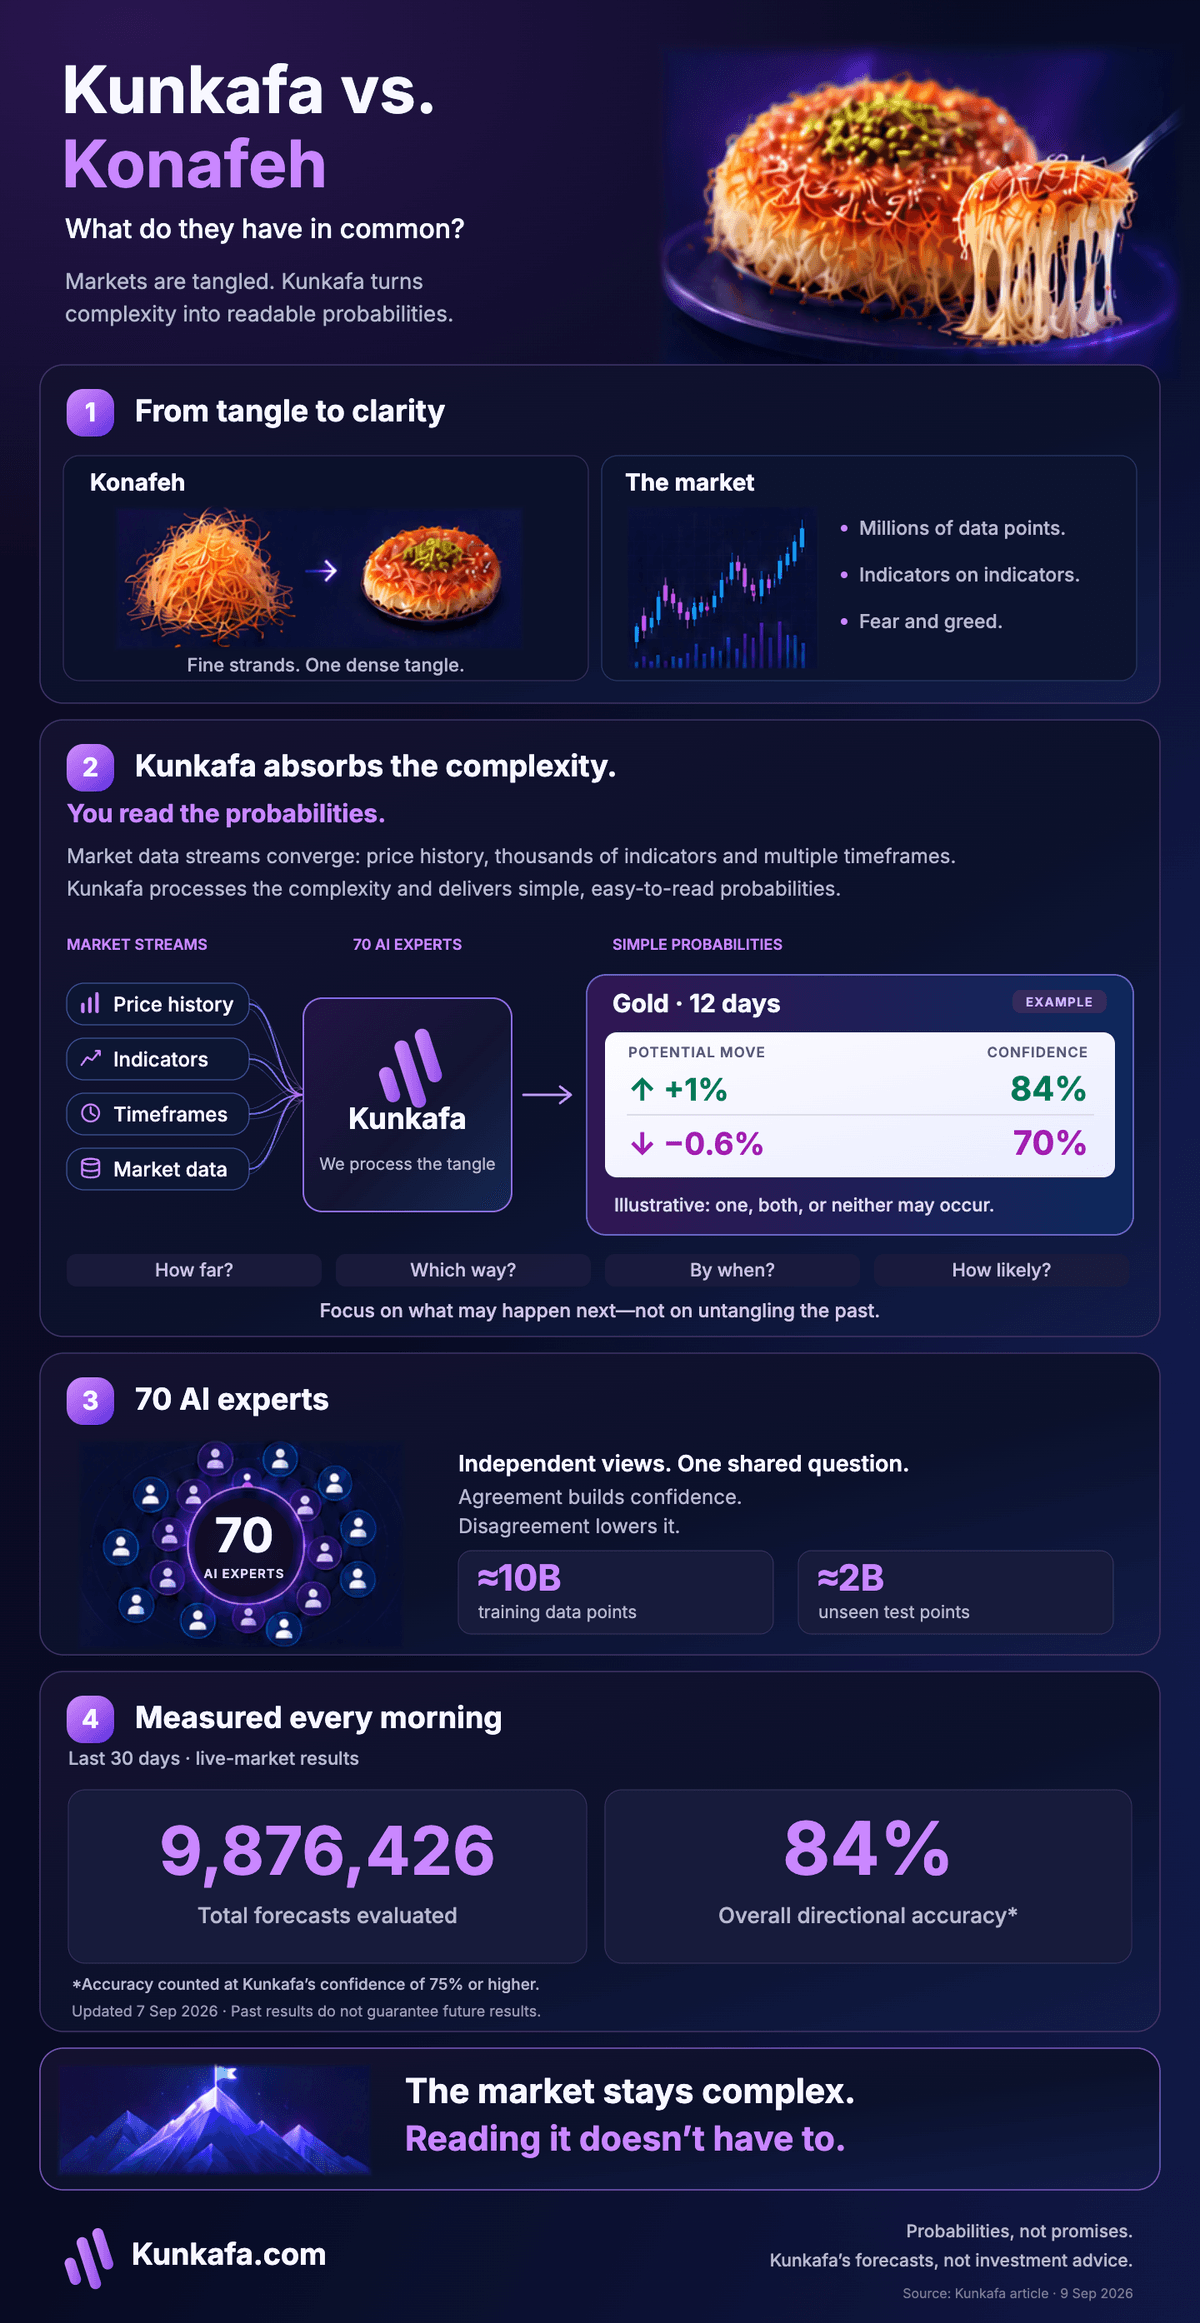
The name sounds like a joke. It is a design brief: take data that is tangled beyond reading and make it simple.
Look at a plate of konafeh. A dense tangle of golden strands, promising a pleasure nothing else matches. Then eat it, and feel the weight. The more you eat, the heavier it sits, because your body is spending everything it has on digesting it.
Now look at gold, a stock or a currency. You go deeper: the price charts, then dozens of indicators, all to understand what is happening and find a move that pays like that first bite, and costs like that heaviness when it goes wrong. Your mind ends up as tired as your stomach.
This is where Kunkafa comes in. Seventy AI experts, built for data that is tangled and, at times, close to absurd. Their job sounds impossible: untangle every strand of the konafeh until it becomes a dish that is delicious and simple at the same time.
The finding. A market is a tangle, like konafeh: millions of thin strands that no eye can separate. It cannot be read simply.
Where Kunkafa stands. Kunkafa takes the whole tangle and serves one card: how far, which way, by when, and how sure, with the other side directly below it. Seventy experts do the work, and the record is counted every morning.
What to do. Stop trying to read the strands. Read the card, both directions, then the record.
What konafeh is
Konafeh is the dessert you know from Egypt and the Levant. It starts as batter poured onto a hot plate in threads as fine as hair. Then the threads are gathered into one dense, tangled mass. Look at the finished plate and try to find the first thread. You cannot. The start and the end are two different things.
What a market screen is
Open a chart. Millions of candles. Millions of data points. Indicators stacked on indicators: RSI, moving averages, Bollinger bands, support and resistance, three durations at once.
Every line is a strand. Together they are the tangle.
After a while nobody can separate one from another, and nobody can pull a probability out of it. So the answer comes from somewhere else. Greed sees only the rise. Fear sees only the fall. Neither is a probability. Both feel like one.
Kunkafa makes the plate
Kunkafa does the opposite of the konafeh maker. It takes the dense, tangled mass and turns it into something simpler, something a person can read and understand, so their effort goes where it matters: weighing the scenarios that may come next, instead of spending time and energy re-reading the past.
 Gold· 12 days
Example
Gold· 12 days
Example
Could Gold go up 1% within 12 days?
84%
Kunkafa’s confidence in reaching it
↓ Down 0.6% in the same period: Kunkafa’s confidence: 70%
Either, both or neither could happen.
The homepage example says it in a sentence. Could gold go up 1% within 12 days? Kunkafa’s confidence: 84%. Below it, the other side: down 0.6% in the same period, 70%. Either, both or neither could happen. The figures are illustrative.
That card is the whole job. How far. Which way. By when. How sure. And what the other path looks like.
The same card can be read three ways, from the question to the full view, depending on how much you want on screen. Before you go further, read One Forecast, Three Ways to Read It and pick the level that fits you.
Seventy experts, not one
The card is not one model’s opinion. Seventy experts each look at the same market from their own angle on the price history and thousands of indicators and data points, and answer the same question. None of them sees the others’ answers.
When they agree, the probability is clear. When they disagree, it drops, and you see that too. A 52% is shown as 52%.
They were trained on about 10 billion data points of price history across stocks, indices, currencies, commodities and crypto, and tested on about 2 billion they had never seen.
The plate is weighed every morning
Every morning Kunkafa counts how past forecasts ended, on live markets, and publishes the count on the results page: how many were evaluated, how many were confident enough for the published filter, how many reached the level. This table is rendered from the same file as the results page, at Kunkafa’s confidence of 90% or higher.
| Window | Forecasts evaluated | Confident enough | Reached the level |
|---|---|---|---|
| Last day | 0 | Not enough past examples to estimate performance reliably. | |
| Last 7 days | 10,494,183 | 1,328,613 | 88% |
| Last 30 days | 56,576,671 | 7,693,452 | 87% |
| All time | 99,169,602 | 13,158,307 | 87% |
Updated . Past results do not promise future ones. Up and down both remain possible.
Read the count before the rate. Past results do not promise future ones.
Why the name
Kunkafa is not the konafeh. It is its opposite. The market stays a tangle. The plate is what may happen next, served as a simple dish, with all the pleasure of konafeh and none of the heaviness.
Read a live market in the Kunkafa market forecast app, or start your 7-day free trial.
Markets in this article
Keep reading
Twelve guides that go with this one, by the question you came with.